https://www.cgdev.org/blog/which-countries-are-most-exposed-us-aid-cuts-...
by Ian Mitchell and Sam Hughes
While it is still unclear how long the current freeze on US foreign aid will last, and when and where it might resume, it seems the US, under the second Trump administration, may be ready to abandon its role as a lead aid provider. If so—other countries will need to step up.
Here, we look at which countries will feel the biggest impacts according to the latest data. We put US support in context of countries’ own incomes, and how much support they received from other donor countries.
If USAID funding were paused for a year, the resulting shock would exceed 1 percent of GNI in 23 economies, with eight experiencing a devastating hit of 3 percent or more. Eight low-income countries and eight lower-middle income countries face losing over a fifth of the total foreign assistance they receive.
With USAID freezing funds and repatriating staff, there is an immediate need for other donors—particularly Germany but also Canada, Japan and Sweden—to take the US’s place as lead provider in the most exposed countries. Others, including China, Spain and the UK should bring forward their plans to increase assistance to to prevent lives from being lost and fragile states from further destabilsation.
Should the US fully turn away from the world’s poorest countries, the effect on extremely poor people will be devastating. For governments prepared to commit a modest share of taxpayer revenue to saving lives, averting malnutrition, and maintaining stability, this is a moment to step up. Aid budgets must be reoriented towards the poorest countries—before the cost of inaction becomes irreversible.
Hope for the best, plan for the worst
At the moment of writing, the Trump administration has curbed the work of USAID—the world’s largest development agency—having issued stop-work orders affecting programming around the world and seeking to recall thousands of country-based staff to Washington. Relying on a skeleton staff, it seems unlikely the administration will be able to review and release funds anytime soon. While there’s still time to change course and mitigate some of the worst effects, countries around the world would be wise to act now in response to a less globally engaged United States.
The US not been a generous aid donor relative to its income since the 1960s; but it has always been the largest in absolute terms. Relative to other providers, a major feature of US support is that it has tended to focus on the poorest countries.
How do we assess recipient exposure?
We look at vulnerable low- and lower-middle income aid recipient countries who are exposed to USAID cuts: either because a large share of their total aid comes from USAID (over a fifth), or because they receive a large amount of aid relative to their Gross National Income (GNI). We calculate these metrics for all aid recipient countries here (alongside additional information such as the amount of aid they receive per person) but focus here on the 26 low-income countries (LICs) and 51 lower middle-income countries (LMICs). For each recipient country, we also identify its largest non-US provider of development assistance to indicate who is now best-placed to take a lead role among providers.
There are several other factors that development agencies can and should consider in a more careful analysis. In particular, humanitarian needs may be more pressing; there may providers that do not report to the OECD; and there may be sector impacts, and exemptions, that shape the impact of US’s aid freeze. Still, we hope that this analysis will inform planning.
Which countries are most exposed?
Of the 26 poorest countries in the world, we identify eight where over a fifth of their assistance comes from USAID—specifically, South Sudan, Somalia, Democratic Republic of Congo, Liberia, Afghanistan, Sudan, Uganda and Ethiopia. In all but two of these countries USAID’s focus is categorized as “emergency response”—albeit for relatively protracted crises. This suggests aid is being used to address acute needs within these countries. In Liberia, basic health is the main sector while in Uganda it is population and reproductive health.
Figure 1. Low-income countries where USAID provides over one-fifth of ODA
|
Country |
GNI per capita ($) |
Population (millions) |
ODA per person ($) |
ODA % GNI |
US share |
USAID share |
Largest non-US provider |
Largest non-US bilateral provider |
|---|---|---|---|---|---|---|---|---|
|
South Sudan |
N/A |
11 |
157 |
25%* |
40% |
36% |
IDA |
Germany |
|
Somalia |
1,550 |
18 |
135 |
23% |
40% |
40% |
IDA |
Germany |
|
DR Congo |
1,560 |
106 |
42 |
7% |
28% |
27% |
IDA |
Germany |
|
Liberia |
1,680 |
5 |
110 |
15% |
26% |
23% |
IDA |
Sweden |
|
Afghanistan |
2,220 |
41 |
76 |
20% |
39% |
35% |
EU |
Germany |
|
Sudan |
2,720 |
50 |
29 |
3% |
31% |
29% |
EU |
Germany |
|
Uganda |
3,040 |
49 |
50 |
5% |
28% |
21% |
IDA |
Germany |
|
Ethiopia |
3,050 |
129 |
44 |
4% |
28% |
27% |
IDA |
Germany |
|
All LICs |
|
736 |
71 |
8% |
22% |
19% |
|
|
Source: Authors analysis of OECD CRS data (ODA in 2023) and World Bank WDI data. *South Sudan figure uses IMF 2023 GDP data and is excluded from the group average below.
The economies of these eight low-income countries are so small that aid makes up an average of 11 percent of their total income (based on available GNI data for seven countries). With USAID providing 30 percent of that support, the freeze could create a shortfall equivalent to over 3 percent of GNI—a potentially major economic shock for countries that are home to 410 million people. For context, low income countries grew by just 3 percent in 2023, and are estimated to have grown 3.6% in 2024.
Many lower income countries that receive US support are all already relatively under-aided—LICs received $71 of Official Development Assistance (ODA) per person on average in 2023. With potential USAID reductions; several other poorly supported countries would see support under $60 of ODA per person: Madagascar, Burundi, Niger, Mali and Chad (or $150 per person in extreme poverty given a poverty rate of over 40 percent). To put this in context, if total ODA ($223bn) were shared among the nearly 700m extreme poor, they would receive over $300 per person per year.
Looking at the group of lower-middle income countries; a further eight rely on USAID for a fifth of their support: Haiti, Lesotho, Zimbabwe, Kenya, Honduras, Angola, Jordan and Eswatini. These countries have widely differing circumstances. Haiti faces major humanitarian needs while others see the US focus on population and reproductive health. In Jordan and Honduras, it is “general government and civil society” support, while Angola receives basic health support.
The above analysis focuses on support funded through USAID, but the spending freeze applies to much of the foreign aid provided through other agencies including the State Department. This would mean another three low-income countries—Mozambique, Malawi, and Niger—and a further five LMICs—Lebanon, Zambia, Micronesia, Pakistan, and Nigeria—could lose a fifth of their overseas support.
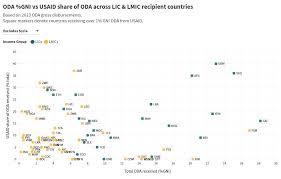
How big are potential cuts relative to recipient economies?
The chart below plots this data and identifying the share of countries ODA that would be lost from a USAID freeze or cut, and how total ODA relates to their GNI. This shows if USAID’s freeze went on for a year it would leave twenty-three economies facing at least a 1 percent economic shock (sixteen LICs and seven LMICs). Eight of these would face at least a 3 percent blow: South Sudan (9 percent), Somalia (9 percent), Afghanistan (7 percent), Liberia (4 percent), Syria (5 percent), the Central African Republic (4 percent), Yemen (4 percent), and Micronesia (3 percent).
Aid is an important contributor to economies in lower-income countries. Sometimes it does not score formally in countries GN—it is rarely provided directly to recipient governments and goods or services may be supplied by contractors from elsewhere . At the same time, aid often funds services that generate economic benefits far beyond their initial cost—for example, health spending that enables people to work and contribute to the economy. Looking at ODA as share of GNI then is a reasonable guide to the economic impact.
Figure 2. Importance of aid to lower income economies and share from the US

Source: Authors’ analysis of OECD CRS & World Bank World Development Indicators
Notes: Data for 75 low and lower-middle income countries (due to missing GNI data, the above chart excludes Eritrea and North Korea (LICs)).
Who should lead provider efforts?
There has long been recognition of the value of providers coordinating their efforts in partner countries; and structured “country-platforms” (where multiple providers align funding and strategy with national priorities) are seen as key to delivering real economic change in partner countries. The US was the largest bilateral provider in 18 of 26 LICs. Here, we identify the largest non-US provider, in each recipient country. This should provide a guide to the country which is likely best-placed to step up on provider coordination.
In the low-income countries; the World Bank’s International Development Association (IDA) is the largest non-US provider in the majority, with the EU the largest in Afghanistan and Eritrea. However, there is also a bigger role for bilateral providers—Germany stands out as the largest provider in six of the eight most-exposed low income countries; and Sweden in the other. The UK is conspicuous by its absence here – as we’ve noted, it’s focus on the poorest countries has waned, and it is the next-largest provider in just one of the 26 LICs.
In the eight LMIC countries most exposed, Japan is the lead in three; Germany in two and France, Portugal and the UK in one each; and the IADB and CABEI each play a lead role.
As well as immediate coordination, providers in-country should also plan for scenarios where US programs resume, or are cut completely. In the latter case, this planning should consider the option of (perhaps jointly) taking over curtailed US-funded programs based on an assessment of effectiveness and expected impact relative to existing activities. Providers should also consider the countries where the US is providing humanitarian or emergency support (like Afghanistan, Somalia and Sudan); and where it’s role has been longer-term development on health (like Liberia and Uganda).
Who could step up?
US support is too large to be fully replaced, but other providers’ ODA budgets could be refocused and at least some of the worst effects could be ameliorated.
The UK is showing signs of recommitting to poverty elimination; and if it accelerated the release of funds from refugee hosting, it could play a crucial role in saving lives and stabilizing countries. Germany is already playing a major role; though it has room to focus more of its bilateral ODA in poorer countries. This is also true for France and Japan. Canada can show its values are distinct from those of its closest neighbour. Spain has ambitions to increase its development spend, is hosting the financing for development conference in June, and could play an important role.
The US’s absence should encourage other provider countries to step up too. China pledged last autumn to increase its support for Africa to over $50 billion across three years and could potentially bring forward plans; and increase the share of grants over loans. Saudi Arabia and the UAE have been generous ODA providers in the past; and each is now the lead provider in several lower income countries.
Where next for development?
President Trump appears prepared to turn the US inward, while using its power to force concessions from others. Leaders have already capitulated and appear increasingly wary of criticizing the US approach. Still, that does not mean that countries should follow the US lead. Should the US government curb support for the poorest countries in the longer term, we urge other providers to respond by being willing to re-target aid where it is needed most; make the case for helping others, and ensure aid is focused on impact.
Figure 3. ODA per person from the US and other donors, 2023
Recipients ordered by GNI per capita, from poorest to richest.
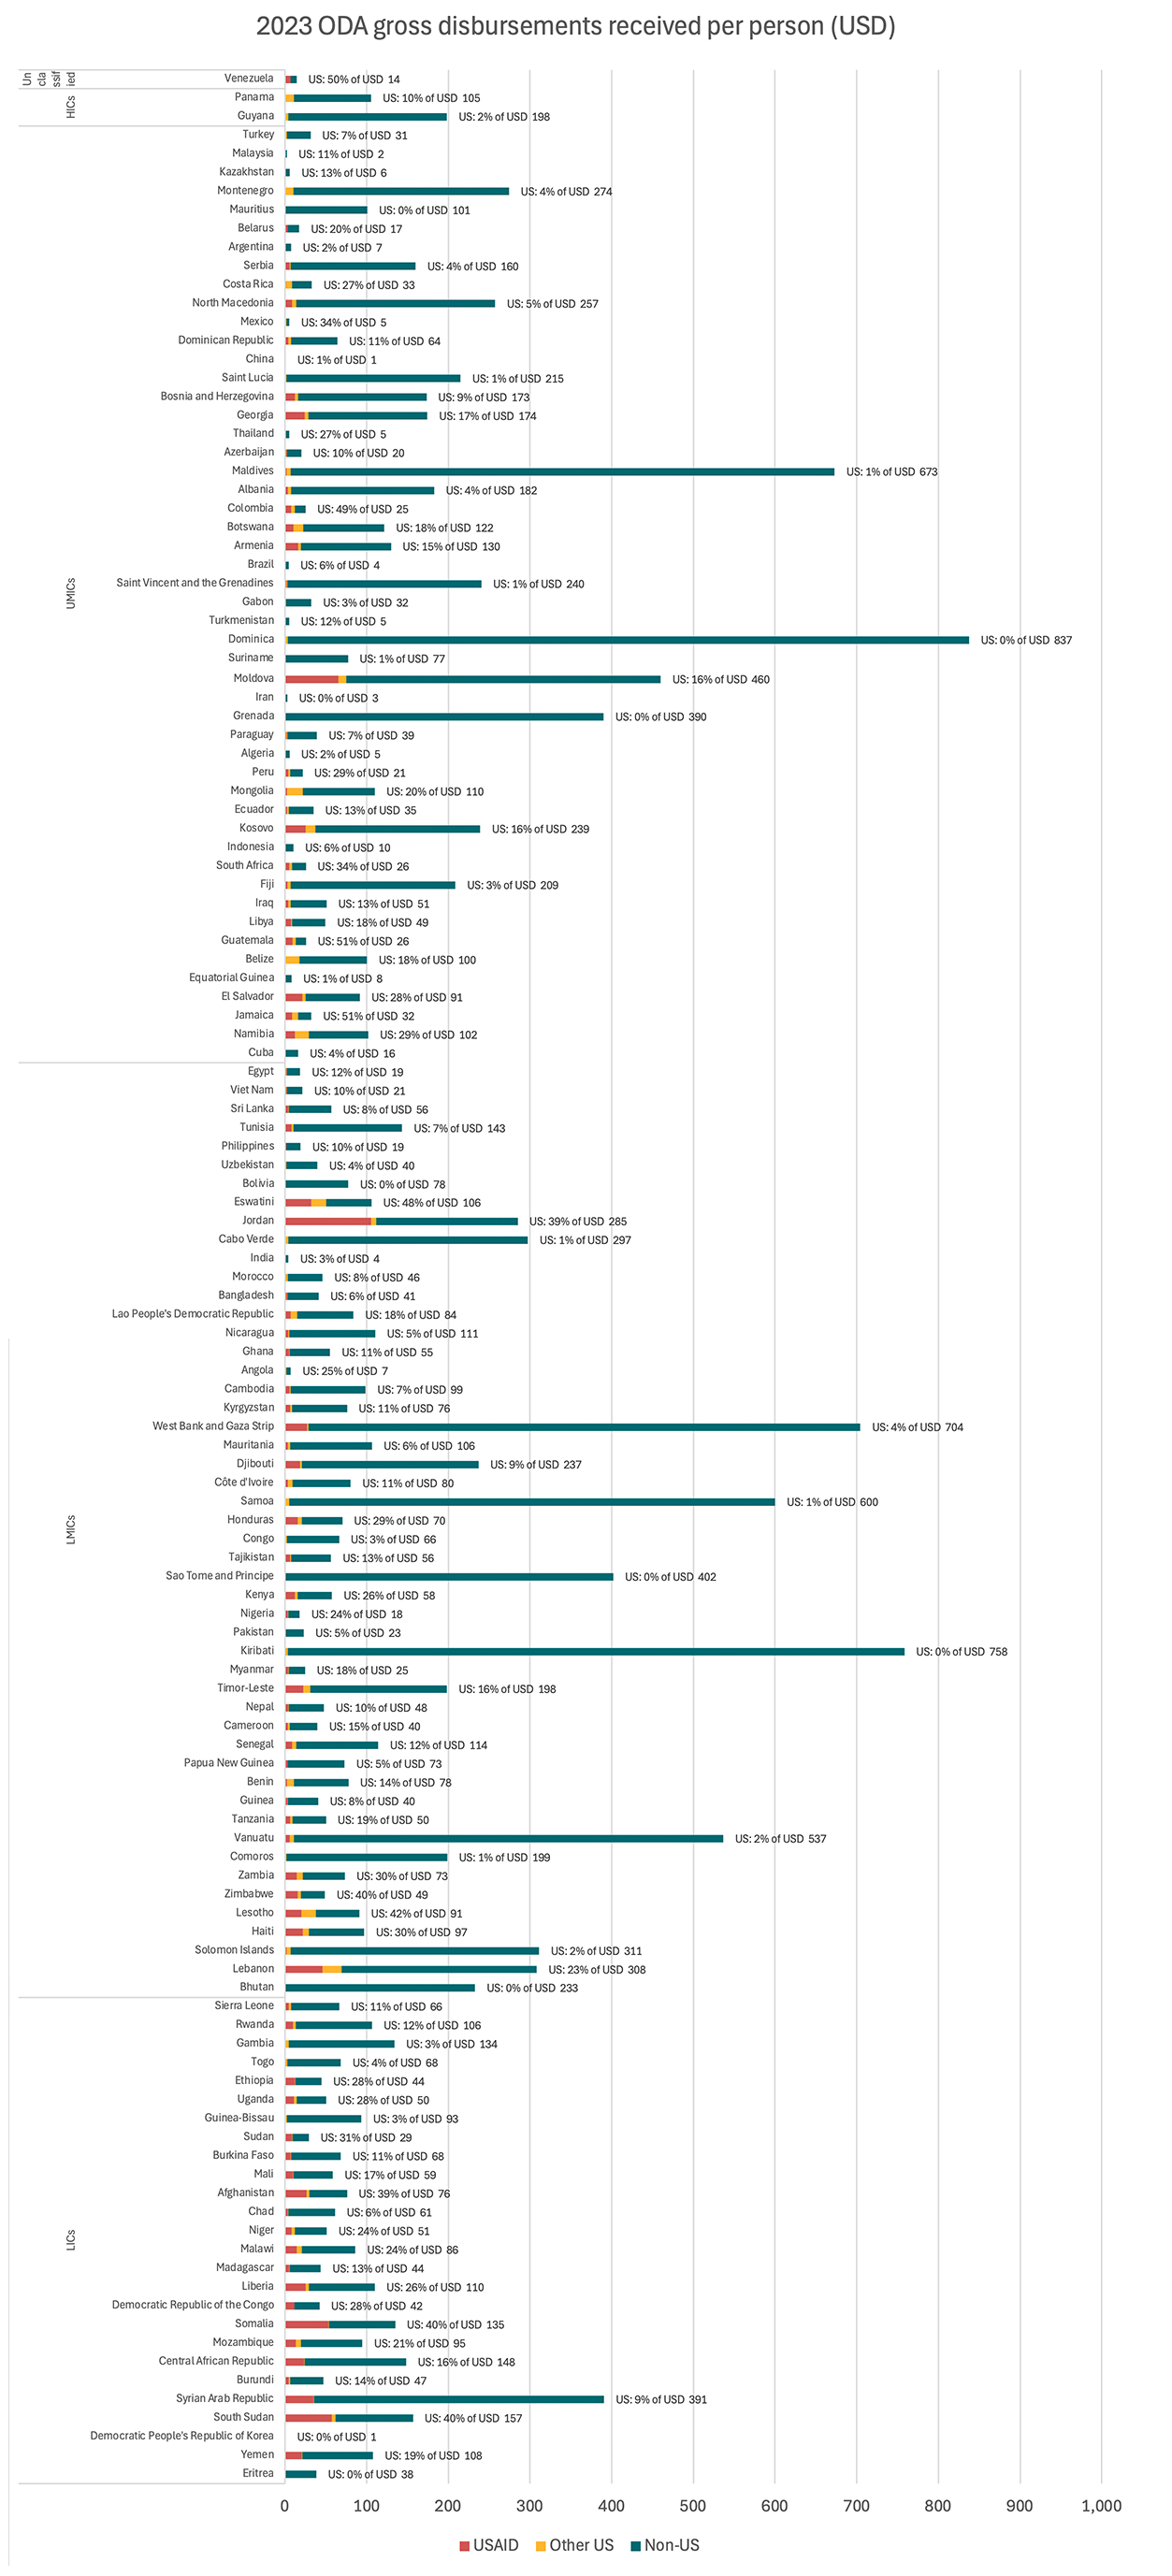
Source: Authors analysis of OECD CRS data (ODA in 2023)
We are very grateful for comments from Erin Collinson, Charles Kenny, Ranil Dissanayake, and Justin Hurley on an earlier version of this blog.
Disclaimer
CGD blog posts reflect the views of the authors, drawing on prior research and experience in their areas of expertise. CGD is a nonpartisan, independent organization and does not take institutional positions.
Image credit for social media/web: Catholic Relief Services / USAID